
What are Venn diagrams?
A Venn diagram, named after John Venn in the 19th century, provides a convenient way to represent a sample space. Click here to remind yourself of what a sample space is.
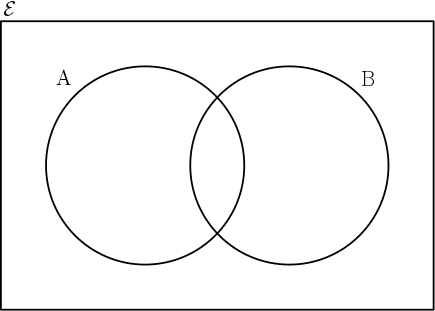
A Venn diagram is a rectangle representing the whole space, which we call  , and circles inside representing various subspaces. For example, A could represent the event that a person has blue eyes. Event B could be that person having brown hair. See Mutually Exclusive and Independent Events for more.
Events on a Venn diagram
Complement

This Venn diagram shows the complement of A. The part shaded with diagonal lines is everything that is not in A and we call this the complement. Note the spelling – it doesn’t say ‘compliment’ as charming as event A might be. See Example 1.
Union

In this Venn diagram we see the union of events A and B. This means that the shaded part represents all outcomes where either event A or event B has occurred. See Example 2.
Intersection
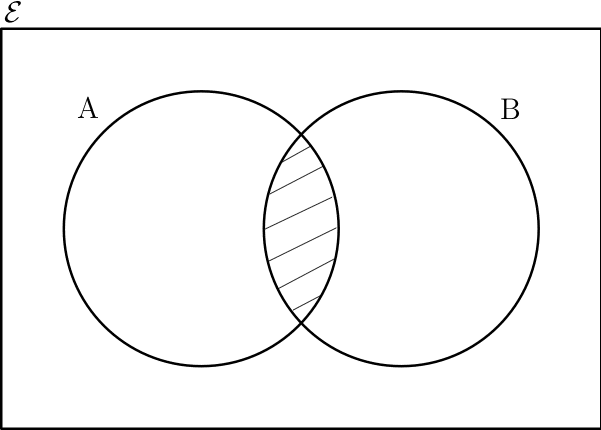
Alternatively to the union, there is also the intersection of two events. The intersection represents the set of all outcomes where BOTH events A and B have occurred. See Example 3.
Combinations

It follows from the three previous definitions that it is possible to combine complement, union or intersection to get particular areas of a Venn diagram. See Example 4.
In A2 Maths, we extend these ideas and introduce set notation when we look at conditional probabilities.
Examples
Let event A be an even result when a dice is rolled. Additionally, let event B be the even that the result is greater than 2. The probability of not A is getting an odd result.

Odd results are 1,3 or 5 (shaded part) and so in this case  .
.
Again, let events A and B be an even result and a result greater than 2 respectively when a dice is rolled. The probability of A or B occuring includes all of the following results: 2,3,4,5 or 6.

It follows that .
.
If A is an even result when a dice is rolled and B is a result is greater than 2, the only times you would get both are if you roll a 4 or a 6.

It follows that the probability of the intersection is  .
.
Consider again that A is an even result and B is a result greater than 2 when a dice is rolled. Results that require A not happening, i.e. an odd result, as well as B occurring includes only 3 and 5.

Finally, in this case  .
.
A card is chosen at random from a standard deck of 52 playing cards. Let K be the event that the card is a King. Let H be the event that the card is a heart. Find:


Solution:
This question is simple enough to answer without a Venn diagram but it can be less confusing when visualising some of the combined events.

 is the intersection of K and H. This represents the event that the card is both a King and a Heart. Since the only card that is both is the King of Hearts, the probability is given by
  .
.- Not H means not a heart means that the card can be a spade, a diamond or a club. There are 39 of these and so
 .
.  is the event that the card is either a King or a Heart. There are 4 Kings and 13 Hearts but the King of Hearts is included in both of these. We can see from the Venn diagram that
  .
.- Not K and not H represents the event that neither a King nor a Heart can be drawn. The easiest way to deduce this probability is to see where everything outside K overlaps with everything outside H. This can only be from the 36 cards that are not in either and so

 is the intersection of K and H. This represents the event that the card is both a King and a Heart. Since the only card that is both is the King of Hearts, the probability is given by
  .
. .
. is the event that the card is either a King or a Heart. There are 4 Kings and 13 Hearts but the King of Hearts is included in both of these. We can see from the Venn diagram that
  .
.
A school has 204 students. 85 of them have chosen to study Maths, 56 of them have chosen to study French and 68 have chosen to study History. It turns that 35 study both French and Maths, 23 study both Maths and History and 27 study both History and French. 7 study all three subjects.
- Draw a Venn diagram to represent this information.
- Find the probability that a student does not study Maths.
- Find the probability that a student does none of these three subjects.
Solution:

- There are 109 students who do not study Maths and so the probability is 109/204.
- There are 73 students that do not take any of three subjects mentioned and so the probability is 73/204.

The hardest part of this question is getting the information into the original Venn diagram. The easiest thing to do is identify the inner most intersection, i.e. the number of students who take all three subjects. From there, it is possible to identify the parts connected to the central piece followed by the remainder of the circles. You should then be able to identify final number of students who don’t feature in any of the circles to make the number up to 200.