
Trigonometric Graphs
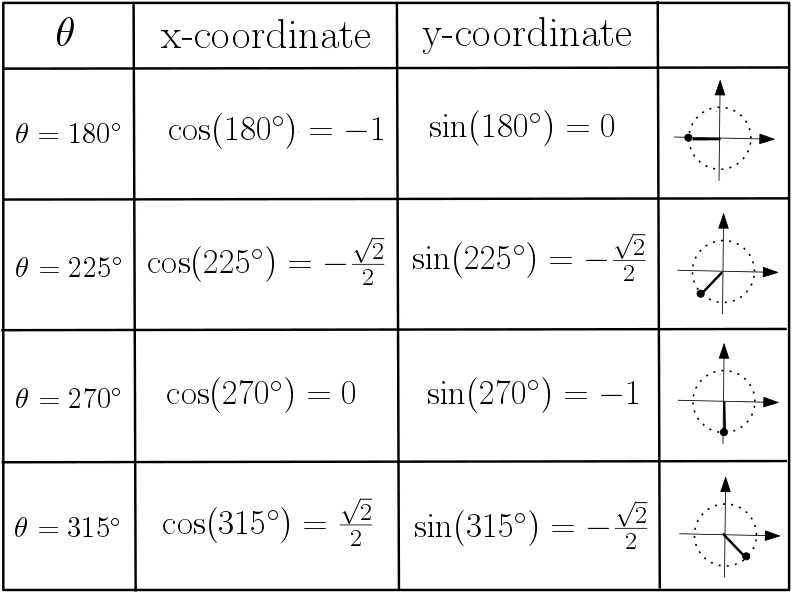
We derive the trigonometric graphs of sin, cos and tan from the unit circle. Imagine a particle going round the unit circle. Let  measure the anti-clockwise angle between the particle and the
  -axis. We can think of the value of
  as the coordinate of the particle. Similarly, we can think of the value of
  the
the  coordinate. See the table below.

Exam questions on trigonometric graphs may expect you to have memorised these values. Additionally, you should also know values of sin(x) and cos(x) at x is 30 and 60 degrees. See Trigonometric Identities. They may also expect you to perform transformations to trigonometric graphs. See Examples 1 and 2 here after studying the graphs below. Click here for a reminder of Transformations.
The graphs of cos(x) and sin(x)
We now plot the -coordinate of the particle against the angle. Calculating the coordinates for all using a scientific calculator will give the following curve:

Local lines of symmetry are vertical lines at every  .
.
In other words, they have equation  where
where 
(what does this mean?).
We can also plot the -coordinate against the angle of the particle. Calculating the coordinates for all using a scientific calculator will give the following curve:

Local lines of symmetry are vertical lines every starting at  . In other words, they have equation
  (or equivalent) where .
Both values on the sin and cos graphs are bounded between -1 and 1. The tan graph, however, can take values between  and
and  . Both cos and sin graphs repeat every
  . We say that they have periodicity of .
When solving trigonometric equations, scientific calculators tend to only give default solutions. However, the lines of symmetry above can be used to find all solutions in a given interval. See Trigonometric Equations.
For obvious reasons, sin and cos graphs are sometimes called waves. You may also be interested in the amplitude and wavelength. Firstly, amplitude is the height of the wave. Secondly, the wavelength is how long a single wave is.
The graph of tan(x)
We now plot the -coordinate of the particle against the angle. Calculating the coordinates for all using a scientific calculator will give the following curve:
Local lines of symmetry are vertical lines at every .
In other words, they have equation where
(what does this mean?).
Recall that  from the trigonometric identities. The graph of
  is given below. It can be thought of as the ratio of vertical to horizontal components of the above particle.

As opposed to cos and sin, tan is not restricted to taking values between -1 and 1. Tan can in fact have any positive or negative values. However, the tan graph has asymptotes – lines that are never touched. These lines occur every starting at . They appear as a result of dividing by  in the expression . Tan has no reflectional lines of symmetry but it does have a periodicity of .
Examples
Sketch the graph of  .
.
Solution:
First notice that this is a -transformation. Namely, we multiply the coordinates by 2. This stretches the graph by a factor of 2 in the y direction. See more on transformations.
Sketch the graph of  .
.
Solution:
Notice now that this is an -transformation. That is, we multiply the coordinates by 2. This stretches the graph by a factor of a half in the direction. See more on transformations.
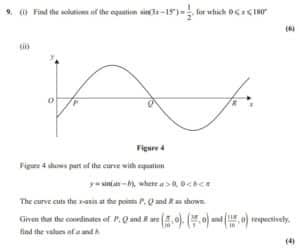
Solution:
Note that this question requires knowledge of radians (coming soon). This is an alternative angle measurement to degrees. Specifically, is  radians. This means that
  etc.
etc.
You will also need to be very careful with the transformations. Namely, identify the transformations when replacing with  carefully. Firstly, replace with
  . Then replace new with
  x. Of course that is if you are choosing to use transformations. An alternative would be to substitute coordinates.
See video below for full solution.
Videos
Identifying possible values of an unknown constant by considering transformations to a sine curve.
Transformations of a sine curve that is used to represent water depth.
Finding multiple solutions of a trigonometric equation without using cast then finding unknown constants buy considering successive transformations to a sine curve.